Competitor Advertising Analysis: How to Read Rivals' Ads
Learn how to find, log and interpret competitor advertising analysis data, from ad libraries to podcast sponsors, with a practical step-by-step method.
A competitor that ignored paid social for a year is now in your feed on three platforms, in the sponsor slot of two podcasts you listen to, and at the top of search results for your category term. The instinct is to screenshot everything, drop it in a folder, and call it competitive research.
Screenshots prove the rival is spending. They don't prove the spend is working. Public ad libraries show creative, placements and run dates, and they stop there. Budgets, targeting, conversion rates, margins and attribution sit behind a wall no external tool climbs.
Treat every competitor ad as a hypothesis with a test attached. That single habit separates a monthly routine that changes budget decisions from a folder nobody opens twice.
Table of Contents #
- Where Rivals Advertise and What Each Source Shows
- How to Collect Competitor Ads Step by Step
- Logging Each Ad So Findings Stay Comparable
- Separating Visible Ads from Real Performance
- Reading Podcast Sponsorships as Competitor Signals
- Decide Your Next Move from the Evidence
Where Rivals Advertise and What Each Source Shows #
Start in the Meta Ad Library and the Google Ads Transparency Center. Between them they cover the placements most rivals use to reach the same buyer, both are free, and both update continuously. If the competitor sells to businesses, add the LinkedIn Ad Library. If it targets a younger consumer, add the TikTok Creative Center. If it carries a brand budget rather than only a performance budget, add podcasts, where sponsorship is read aloud by a host and no public library records a word of it.
Channel mix is the reason the search pays off. WARC projected global advertising growth of 8.2% for 2024 and forecast social-media advertising at $227.2 billion, or 21.8% of worldwide advertising expenditure, so a rival can move real money between platforms without its total outlay shifting at all.
Each source answers a different question and hides a different piece of the picture.
| Source | Channels covered | What you can see | What stays hidden |
|---|---|---|---|
| Meta Ad Library | Facebook and Instagram | Active ads, creative, platforms and run dates | Budgets, targeting and conversion results |
| Google Ads Transparency Center | Google Search, YouTube and Display | Advertiser-verified ads, formats and regions | Bids, keyword lists and campaign spend |
| TikTok Creative Center | TikTok | Top ad examples and trend data | Full campaign budgets and targeting |
| LinkedIn Ad Library | Active sponsored content by advertiser | Targeting detail and campaign results | |
| Podzone sponsor tracking | Podcast advertising | Ad reads, sponsors, offer codes and timestamps | Listener response and conversions |
Read the right-hand column as carefully as the left. Knowing that a rival runs twelve creatives on Instagram is worth little on its own. Knowing that four of them have run for two months, all pushing the same trial offer, is a hypothesis worth testing against your own onboarding.
Practical rule: no single source covers every channel a rival uses. Combine at least two sources per competitor before drawing any conclusion, and record which channel returned nothing, because a gap in the data isn't the same as a gap in the strategy.
Podcasts expose the limit of this table most sharply. There's no public library for audio, so the evidence lives inside the episode itself, which is why teams that track audio spend tend to lean on dedicated podcast advertising platforms rather than a generic ad library. The rest of the routine treats audio as a first-class channel, not an afterthought bolted onto a social media audit.
How to Collect Competitor Ads Step by Step #
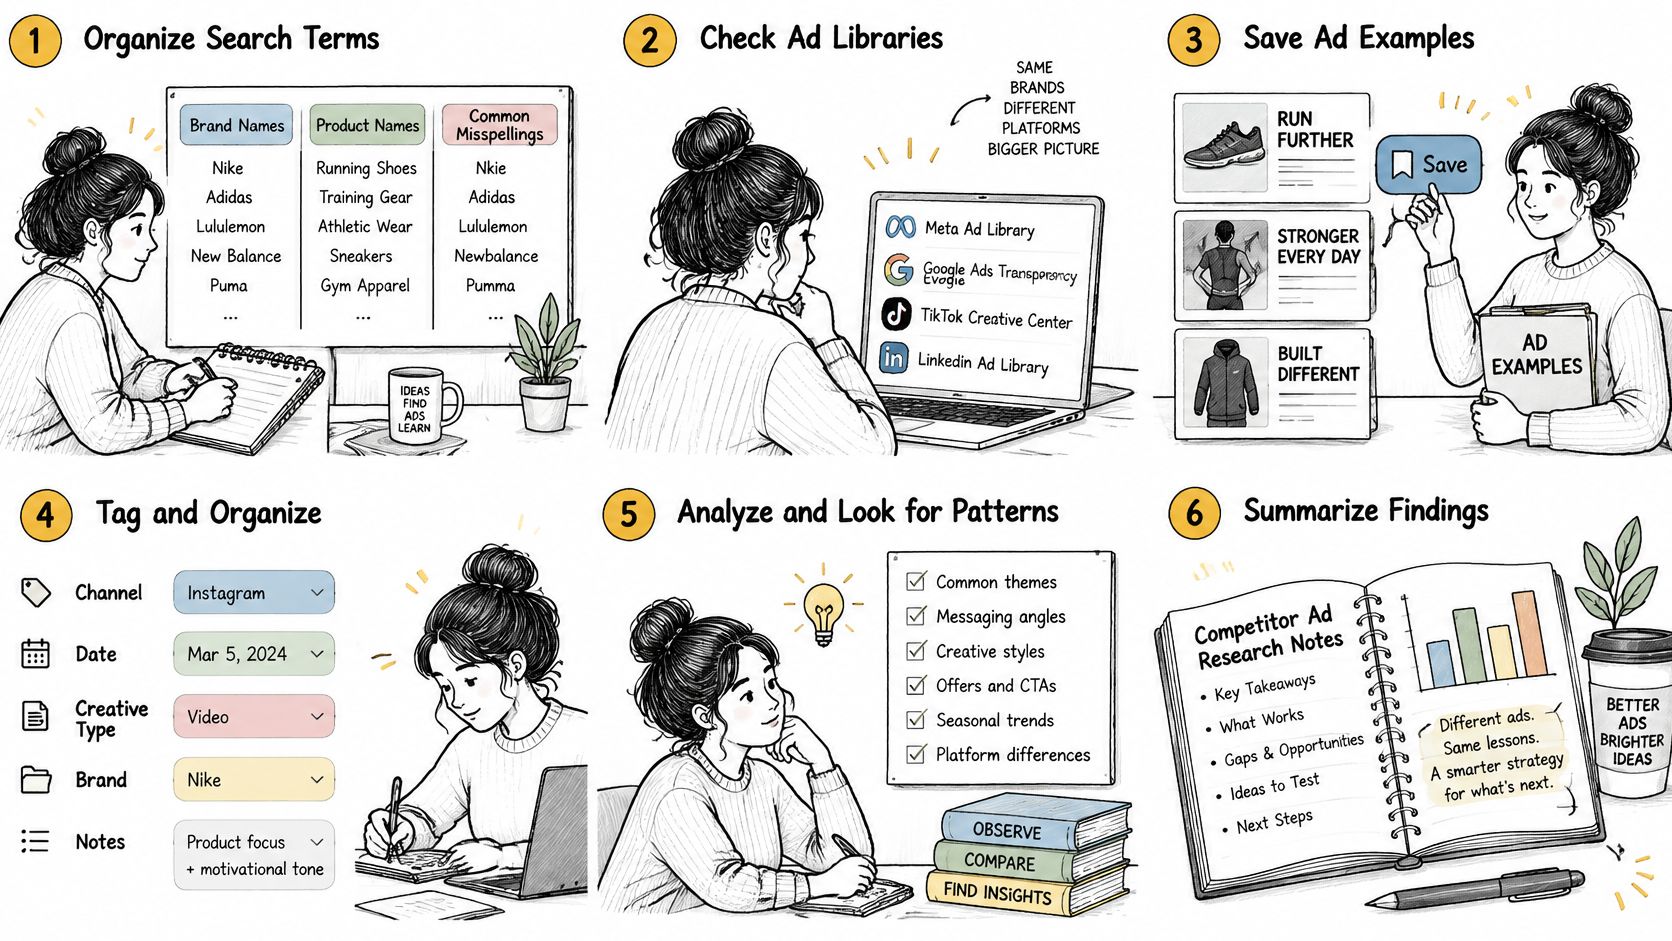
Collection is mechanical, and that's the point. The same searches, in the same order, on the same day each month produce a series that can be compared with itself. Ad hoc browsing produces anecdotes.
- List every name the rival answers to. The brand name, each product line, any campaign name it has used, and the misspellings people type. Ad libraries return what you ask for, so a search that only includes the corporate name misses the campaign running under a product name.
- Search channel by channel, starting with Meta and Google. Mark each result as active or stopped at the moment you look. That status label is the raw material for every later comparison.
- Capture the creative and the date you saw it. A screenshot with the capture date, or a saved copy of the file, because ads vanish without notice and a dead link is not evidence.
- Record run dates and regions, and flag anything live for several weeks. A long-running ad points to sustained investment. A three-day ad usually points to a test, a reshuffle or a mistake.
- Pull podcast sponsor appearances from a tracker. Note the show, the episode, the timestamp of the read, the host, and any offer code, so the audio record sits alongside the visual one.
- Repeat identical searches on a fixed day each month. Identical keywords are the whole method. Change the search terms and you lose the ability to say what changed.
The routine maps to a repeating cycle, and it's worth documenting once so anyone on the team can run it.
The Slip That Costs You the Product Lines #
Searching only the brand name is the most common failure, and it's invisible until a product-line campaign turns up months later in a different source. A rival can run a corporate brand campaign that looks flat while a product launch underneath it performs, and a brand-name-only search shows you neither story.
Build the benchmark set before the first pass: five to eight direct rivals of similar size, plus one or two adjacent brands whose creative tends to travel into your category. Set it once, then track the same names every month. Adding a competitor mid-year is fine as long as you note the start date for that row.
Close each pass by writing down what the sources could not tell you. Budget, targeting and outcome stay blank for every competitor, and those blanks belong in the record as blanks. Filling them with a guess turns an observation into a fabricated number that will be quoted in a meeting six weeks later.
Logging Each Ad So Findings Stay Comparable #
Four screenshots in three folders is not a dataset. One sheet, one row per ad, the same fields filled for every competitor, is. The discipline matters more than the tool: a shared spreadsheet beats a premium platform nobody updates.
| Field | What to enter | Why it matters |
|---|---|---|
| Advertiser and page name | Exact name as shown, plus known variants | Links every ad to one company |
| Channel and placement | Platform and placement, such as Stories or feed | Separates channel mix from total spend |
| Format and hook | Video, static, carousel or audio read, plus opening line | Shows which creative approach repeats |
| Offer or call to action | Discount, trial, code or link | Lets you match offers to later demand signals |
| Message theme | One primary and one secondary theme | Makes messaging comparable across rivals |
| First-seen and last-seen dates | Dates captured from the source | Estimates how long a campaign ran |
A worked row shows why the fields exist. Say a rival pushes a free trial in Instagram Stories and the ad stays live for six weeks. The log records the primary theme as trial and the secondary theme as trust, because the creative leans on a review quote. When the same rival reads a sponsor slot on a podcast six weeks later and mentions the same trial with a different code, the read inherits the same two tags, and the trial push now has a start date, a channel spread and a duration.
One Primary Theme, One Secondary #
Tagging an ad with four or five themes feels thorough and destroys the comparison. Every ad ends up tagged with everything, so nothing distinguishes the price-led campaign from the trust-led one. Force a single primary theme, allow one secondary, and let the rest go.
Practical rule: if two people can't tag the same ad the same way in under thirty seconds, the theme list is too long. Cut it until they can.
Record what the source shows and mark anything else as an estimate. Even industrial-scale monitoring separates observation from modelling: Nielsen's ad intelligence platform covers 5.5 million brands and 4.6 million advertisers across 23 media types and more than 90 international markets, and its spend figures are still estimates alongside observed activity. A hand-built log deserves the same honesty.
Keep the sheet shared with communications, agency and brand teams. The same row then supports a creative brief, a PR response and a media plan, and nobody re-collects what already exists.
Separating Visible Ads from Real Performance #
A campaign that has run for months is the most over-read signal in competitor advertising analysis. Longevity looks like proof because it's the only performance proxy a public library offers. It isn't proof. Public ad libraries cannot reveal budgets, targeting, conversion rates, margins, attribution models or profitability, as OneMetrik's analysis of competitor ad research sets out, which leaves duration as a weak and frequently misread clue.
A long-running ad can mean any of five things: it works, it's cheap to keep running, a placement contract requires it, it serves a brand goal that never had a direct response attached, or nobody at the rival is measuring it properly. Four of those five look identical from the outside.
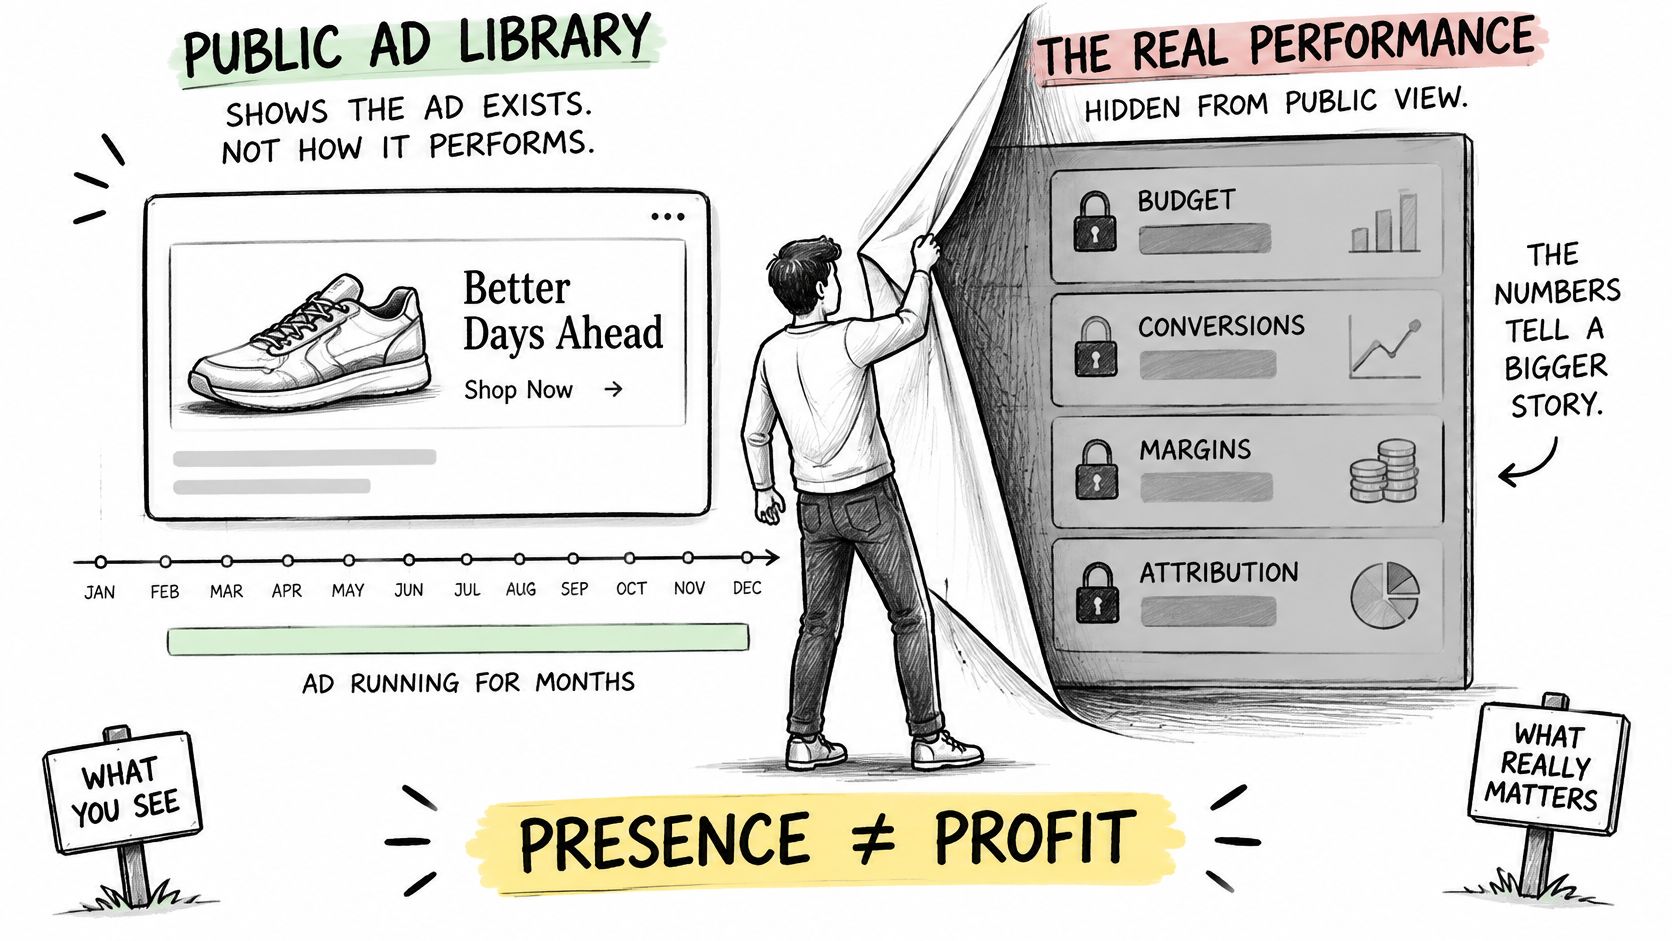
The way out is triangulation. Pair what the ad shows with signals from outside the ad library, and treat each signal as a test with a known weakness rather than a verdict.
| Signal | What it may suggest | Limitation |
|---|---|---|
| Branded-search trend changes | Demand lift after a campaign | Can rise for reasons unrelated to ads |
| Offer-code usage | Direct response to a specific promotion | Misses listeners who search later |
| Review language | Customers mention the promotion or message | Small samples and self-selection |
| Landing-page changes | Competitor adjusts its funnel after testing | Changes may reflect other priorities |
| Traffic-quality indicators | Visits that engage rather than bounce | Hard to see from outside the company |
| Geographic holdout or incrementality test | Whether the ad caused demand | Requires your own controlled test to run |
The last row is the one many teams skip. Attributed conversions include demand that would have arrived anyway, so running a holdout in a matched region, or holding a slice of spend flat while everything else scales, is how a claim about causation gets made. The same logic applies to a rival's tactics: replicate one element in your own account as a controlled test rather than assuming the tactic transfers.
Label Every Finding Before It Reaches a Slide #
Three labels keep a competitive read honest. An observation is what the source shows: the ad, the placement, the dates, the offer code. An inference is what the surrounding signals suggest, such as branded search climbing two weeks after a push started. A validation is a finding you've confirmed with your own test or with data the competitor published.
Those labels stop a deck from stating a guess as a result. A rival's discount offer appears in feed ads and in podcast reads for two months, yet branded search for its name never moves and review mentions stay flat. That's an observation with no supporting inference, so the team records it as unproven and spends its energy elsewhere.
Here is the same discipline applied to reading auction and search signals week by week, which is where most paid teams start.
Reading Podcast Sponsorships as Competitor Signals #
Podcast sponsorship is the channel where competitor creative is hardest to fake and easiest to miss. A host reads the claim in their own words, often for the same brand across many episodes, and no public ad library captures what was said.
The capture side is closing. Each new episode's transcript and show notes are read automatically for sponsors, and every ad read is timed from the transcript, so the moment a rival's read starts and stops is recorded rather than estimated. Each read is matched to the company behind it however the brand's name was spelled on air, so a rival heard three different ways counts as one sponsor. A brand that appears only in the show notes, with no ad read, still gets counted and is marked as named in the show notes only, which separates a passing mention from an actual buy.
Measurement still lags. Advertisers are still building confidence in how to measure podcast ads, even as their plans for audio spending remain strong. Treat that gap as an advantage: a rival's audio spend is a hypothesis you can test, not a result you have to accept.
What to Compare Across a Rival's Podcast Buys #
Four podcast-specific comparisons carry the weight:
- Read frequency per show per month: a rival buying the same three shows month after month is scaling something that clears its internal bar, while a one-off read is usually a test.
- Host credibility and context: a read inside a show whose host uses the product carries a different weight from a scripted slot on a general-interest show.
- Offer-code behaviour: a code that persists across episodes and shows is a deliberate direct-response track, while a code that changes monthly suggests offer testing. Each read is listed with its offer code and the moment it plays, so you can see which promotion ran on which show.
- Repetition and script drift: compare the wording of the same read six months apart. A claim that softens or a proof point that changes shows what the rival learned.
Say a competitor sponsors three shows in one quarter using the same code, and its branded searches rise in the following weeks. Record that as an inference, not proof, because paid social running in the same window can produce the same rise. The analyst who writes "inference, possible confound: Meta campaign" is more useful than the one who writes "podcasts work."
Measure awareness and branded demand alongside coded sales. A read that produces no visible code redemptions can still move search, direct traffic and consideration, and judging it only on codes is how a channel gets cut for the wrong reason. For the range of formats a competitor might be running, these sponsorship marketing examples show how brands structure these buys.
Decide Your Next Move from the Evidence #
The point of all this recording is a decision, and three checks turn a log into one.
- Is the competitor's activity observed in at least two sources?
- Does at least one independent signal support it?
- Would the finding change budget, creative or channel priority?
All three yes: act. First only: plan a test. None: log it and move on.
A rival visible in both the Meta Ad Library and the Google Ads Transparency Center, with branded search rising against it, passes all three and justifies a budget shift or a counter-creative. A single TikTok example fails the first check and gets logged without further work. Revisit each decision after a fixed window, a quarter is enough, so an early read doesn't harden into policy.
Podzone exposes sponsor, search, transcript and people data through its API and through its MCP server for AI assistants, which is how a monthly pass gets automated instead of rebuilt.
Add the competitor's sponsor reads to your log before the next monthly pass.
Podzone tracks which brands sponsor which podcasts, times each ad read in the transcript, and connects a brand to every show it buys however its name was spelled on air. That gives you the audio half of competitor advertising analysis, with the episode, timestamp and offer code attached to every read. Start at Podzone and run your first sponsor search against the rivals you already track on Meta and Google.
- competitor advertising analysis
- ad library research
- rival ad tracking
- podcast sponsor tracking
- competitive intelligence